Ahead of the autumn statement by British Chancellor of the Exchequer George Osborne on Wednesday, 3 December 2014, Ignacio Fernandez provides an economic analysis of fiscal terms for the UK Continental Shelf (UKCS).
UKCS exploratory drilling has been declining since 2008 and reached historically low levels during 2011 and 2013. However most sources agree that there is still substantial exploration potential in the UKCS. There is wide spread belief, across UK government and industry alike, that reforms to the prevailing fiscal terms are urgently required in order to ensure that potential investment opportunities are not lost or stranded.
Since 2000, 358 exploration wells have been drilled in the UKCS yielding a total of 4.1 billion bbl of reserves. The median discovery size is 10MM bbl and the average size is just above 20 million. During 2013 the industry spent £1.6 billion in exploration and appraisal, which yielded discoveries of 80MM bbl (40 million commercially recoverable). At the current rate, it has been estimated that it will take 20 years and 250-500 wells to achieve the exploration potential; recovery of this potential will rely on infrastructure availability.
 |
Of all 2013 exploration investments, large companies, majors and utility companies accounted for 75%. This contrasts with the characteristics of new discoveries, which should attract primarily small to medium market firms because of the size and complexity of new discoveries.
Fiscal regimes have a clear impact on producers’ planning of projects, scope of exploration and resource base. Ideally, fiscal systems should maximize rent-collection without hindering long-run activity. Neutrality is desirable because it allows for market efficiency in the allocation of investments.
Clear and stable rules regarding tax obligations, transfer pricing and cost allowances are also beneficial. It is important to promote efficiency by avoiding gold-plating incentives and premature abandonment. Finally, a fiscal system should elude complexity, enhance transparency and give less scope for discretion.
The government established measures intended to adapt the regime to cost escalation (field allowances) and reduce limitations to cost recovery (100% capital allowance and RFES).
Key Factors
Location
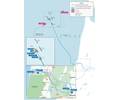
As shown below, the most prospective areas within the UKCS are the Central North Sea (CNS) and West of Shetland.
 |
Installed infrastructure in CNS should enable expeditious development and facilitate recovery from smaller discoveries.
West of Shetland offers arguably the largest remaining exploration potential for significant new finds, by virtue of its relative exploratory immaturity.
For CNS, the average discovery size is almost 38MMboe and the median is 10. On the other hand, for West of Shetland, the average discovery size has been 150MMboe and the median is 43MMboe.
Fiscal Terms
New UKCS developments are subject to Ring Fenced Corporation Tax (RFCT) and Supplementary Charge (SC). RFCT is levied at 30% and SC at 32% chargeable on UKCS upstream profits and companies are allowed to write off all capital expenditures.
Losses can be carried forward/back indefinitely. In addition, the government established a Ring Fence Expenditure Supplement (RFES), currently fixed at 10%, which allows companies that lack sufficient taxable income to uplift tax losses incurred. Companies can uplift a tax loss pool in up to six accounting periods, not necessarily consecutive.
The government also implemented several field allowances for new investments. These result from ad-hoc negotiations and are designed to reduce SC obligations. This study incorporates two of these allowances: the small field allowance and the West of Shetland field allowance.
 |
 |
| Small field allowance. |
West of Shetland field allowance. |
Company size and tax history
The UK fiscal terms apply differently to the “large ongoing operator” which has enough taxable income to offset its capital expenditures 100% the same fiscal year in which they were incurred and the “new entrant investor” who lacks taxable income and therefore has to uplift losses carried forward at the RFES rate for the periods in which it is allowed.
Conceptual framework and Results
Conceptual framework
The case studies developed represent the option to undertake an exploration investment in the UKCS. (Figure Below)
 |
|
The case studies developed represent the option to undertake an exploration investment in the UKCS. |
Historical success rates, especially in the case of mature basins, are commonly used as a proxy for probability of success. Recent estimated historical success rates for the UKCS lie between 22.5% and 33%. The study uses a 26.88% success rate.
The Expected Monetary Value (EMV) is calculated to provide a risk-weighted measure of profitability.
The decision tree shown above was applied to one exploration investment in CNS and one in West of Shetland. For CNS, exploration if successful may yield a 10MMboe field (Field A), 20MMboe (Field B) or 50MMboe (Field C). Field types A and B qualify for small field allowance.
On the other hand, a West of Shetland exploration investment will target larger reservoirs and may yield a 100MMboe (Field D), 250MMboe (Field E) or 800MMboe (Field F) discovery. Field type E qualifies for West of Shetland field allowance.
For the base case scenario, the discount rate used is 10% and the price of oil was assumed at US$90/bbl. The discounted exploration and appraisal investments total $72.3 million and $179.3 million for CNS and West of Shetland, respectively.
Results: Expected returns and division of profits with the government
Central North Sea
The expected IRR for a large ongoing operator results in 14.86% compared to 8.1% for new entrants. Differences occur because the new entrant lacks taxable income to offset these expenditures and therefore must carry forward losses at the RFES rate.
Additionally, for the base case scenario, the discounted profitability index (measured as EMV/I) for the new entrant investor results in 0.13. Sensitivity analysis on the price of oil reveals a variation in the dpi from 0.01 at $70/bbl to 0.22 at $110/bbl.
Deterministic or un-risked field results show that government take indicator is significantly larger for the 50MMboe field where no small field allowance is applicable. Furthermore, the 10MMboe field is unable to take full advantage of the small field allowance. Finally, the large ongoing operator pays taxes earlier than the new entrant investor. Government take indicator oscillates between 46% and 50% for the large ongoing operator; which compares to a range between 20% and 40% for the new entrant investor.
West of Shetland
The IRR for a large ongoing operator is 23.5%, which compares to 10% for new entrants. The discounted profitability index is clearly higher for the West of Shetland investment relative to the CNS one. For the base case scenario, the new entrant investor’s discounted profitability index results in 0.36 and sensitivity analysis on the price of oil reveals a variation in the index from 0.21 at $70/bbl to 0.50 at $110/bbl.
A close look at the deterministic field results reveals that government take is significantly lower for the 250MMboe field (field type E) due to the West of Shetland allowance. This contrasts with the fact that field type E is the most profitable field on “after tax” basis. The field allowance is not neutral since it alters the rankings of projects: field type E was not the most profitable West of Shetland field on a “before tax” basis and yet, turns out to be the most profitable West of Shetland field on “after tax” basis.
Again, PV of tax revenue from ongoing operators is larger than for new entrant investors. In fact, government take indicators range between 37% and 47% for the ongoing operator which compares to a range between 32% and 46%. Moreover, the timing of tax payments makes the present value of tax revenue from large ongoing operators increase relatively to those from new entrant investors.
Results: Limits to cost recovery and the RFES
A possibility that has been considered by the government in order to increase certainty to investors with respect to cost recovery, is an extension of the RFES periods allowable. It was also possible to measure the impact of the RFES when field development is postponed after exploratory discovery and appraisal.
An extension of the RFES periods available would increase expected profitability from marginally profitable fields, effectively reducing the minimum size of discovery required in order to justify commercial development. However, government revenues are significantly reduced and postponed.
 |
Conclusions
Low expected returns to “new entrant” investors partly explain the recent decline in exploratory activity. Despite this, results show that exploration remains attractive for “large ongoing operators.” IRRs from the exercise are almost 15% for the CNS case study and exceed 20% for West of Shetland.
The UKCS system is fundamentally based on CT, therefore, targeting profits and not economic rents. It does not consider investors’ rate of return and is not neutral. Since it is not directed towards economic rents, further changes will be inevitably needed as industry conditions continue to change. Constant changes are counterproductive to promoting investment.
The 100% capital allowances constitute a notoriously progressive element. The provision is binding to investments within the UKCS, inducing companies to maintain their portfolio. However, it’s availability is limited for new entrant investors or firms with no taxable income and therefore, in practice there is differential tax treatment.
The RFES does not provide neutrality with respect to exploration investments. The RFES rate is not a measure of investor’s WACC and unsuccessful exploration investments may never be recovered. Even so, extending the RFES years from six to 10 may allow for more marginal fields to be developed. However, in general, reductions in tax revenues for the government exceed increases in profitability and certainty for investors.
After the introduction of the SC the system has been unable to adapt to cost escalation, motivating the emergence of a plethora of field allowances intended to reduce SC obligations. If targeted properly, these field allowance could enhance flexibility and adaptability of the regime. However, as they have been designed, they are not adjusted for inflation and have the same value for all qualifying fields, when clearly some qualifying fields are more profitable than others.
From the modeling exercise, it becomes evident that a cost-based allowance is more efficient since it will adjust to specific changes in the costs of fields. There is a strong case to advocate for the substitution of all SC allowances with a single cost-based allowance. In addition to field allowances, more neutrality is required in order to promote timely exploration investments from new entrant investors or small and medium sized firms.
Specific reforms to the fiscal system may prove effective in increasing the profitability of the province. However, more thorough asset stewardship will be required in order to avoid lack of cost consciousness. The creation of the Oil and Gas Authority signals the government’s intention to enhance its technical role and involvement.
The UKCS has evolved into a basin with over 300 fields, ever smaller new discoveries and ever growing interdependencies. A neutral tax will benefit government and industry alike and will allow for "market efficiency," thus generating the appropriate business environment in order to “Maximise Economic Recovery” for the UK.
This article was based on the academic paper, “The Economics of Exploration in the UKCS: A case study on the Central North Sea and West of Shetland.”

Ignacio Fernandez is a consultant at Palantir Solutions. He recently graduated from the University of Aberdeen with an Msc, Petroleum, Energy Economics and Finance. His paper, from which this article is written, was a runner up in the Energy Institute's annual best MSc student energy paper competition.
 Subscribe