Figure 1.
 Figure 2.
 Figure 3.
 Figure 4.
 Figure 5.
The use of high resolution sonar in project planning for subsea applications is discussed in this article by Kongsberg Maritime subsea acoustics specialist Ian Florence and senior subsea engineer Craig Wallace.
The history of this project can trace its roots back to 2004 when Hurricane Ivan's 165mph winds caused damage to various oil pipelines and offshore structures in the Gulf of Mexico. After hurricanes Rita and Katrina hit the area the detrimental effects of hurricanes to the offshore oil & gas industry were ever more apparent.
The impact of these storms highlighted the need for proactive risk assessments. Hurricane Katrina itself destroyed 113 offshore oil and gas platforms and 457 oil and gas pipelines spanning many thousands of miles. Reports ranged from platforms completely destroyed to pipes dented and in some cases fractured. The damage to many of these platforms resulted in either gas or oil leaks for several weeks before the wells could be successfully blanked.
In order to close the well the engineers will first need to assess the damage caused by the hurricane. If a platform jacket has collapsed is it obscuring the wellhead? Or has perhaps the debris damaged a pipeline further down?
It soon became clear that a method to quickly and efficiently evaluate the current state of a field post Hurricane was needed before any repairs could be made.Initial survey
In the event of an incident that requires an engineer to assess the situation of any subsea structure, the ability to produce quick, accurate and dimensionally correct images in an easy to read format is imperative. The information gathered will allow the project engineering team to initiate procedures for any remedial action. Immediate needs may include vessel position, lifting, deployment of ROVs, safe working areas and diving operations. The initial survey of the incident location would ideally be as detailed as possible; however, in many cases an overall view of the seabed situation is a priority. This overview will allow the project engineer access to location data in a short space of time, without having to wait a day for processing.
The project referenced in this article was undertaken in the Gulf of Mexico in an area designated an artificial reef. The area consisted of several disused platforms either toppled or placed in the location at Eugene Island block 338 oil field. In addition to the structures there were various disused pipelines, debris fields, seabed disturbance from subsea construction and scars left by jackups and pipeline removals.
The location is in approximately 80m (262ft) of water in a flat seabed area. The aim of the sonar survey was to determine whether the area could be mapped accurately and quickly to give an overview of the area, with areas of interest then subsequently mapped in more detail. Also, could the data be presented in a format that a non-sonar expert could understand and interpret in a timely manner?

Ian Florence joined Kongsberg Maritime 11 years ago and heads up its subsea construction group, specialising in new products for subsea mapping and positioning. He accumulated 30 years' hydrographic industry experience after studying electrical & electronic engineering in Aberdeen. Craig Wallace, a hydro acoustics specialist, joined Kongsberg Maritime as a graduate engineer after gaining a BEng (Hons) degree in electrical/electronic engineering. He later served as customer support engineer before taking up his current role as senior subsea applications engineer.
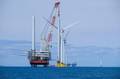
The location, being in relatively shallow water, could in theory have been mapped by a surface vessel system, but it was decided to use an ROV as this would prove that the data acquisition could be obtained at any depth of an operating field.
During this project there was an emphasis on using the latest technology to obtain the best results, and to have a proven solution that could be successfully replicated and further developed in the future.
Mobilisation
With any project the preparation is critical, and work-class ROVs are a common tool during the subsea inspection and construction preparation phases. Unfortunately these ROVs come in various models from manufacturers, each with their own interfacing protocols for transferring the sensor data from the ROV to the surface and into the topside computer. As it was assumed that the ROV would not be known before the operation, it was also understood that any ROV should have a spare fibre for data transfer.
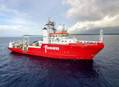
On the above assumption it was decided to supply a tested multiplexer interface for all the equipment and manufacture all the subsea cables so the ROV would only supply the power and one fibre for all the sensor equipment. The multiplexer chosen for the operation was the Seatonics RTS Gen 5. The equipment selected for the data acquisition was the Kongsberg Multibeam EM2040 for mapping and the HiPAP subsea inertial navigation system for ROV positioning. The system was checked in the workshops in co-ordination with the ROV operator who was supplying a Schilling Quest compact electric work-class ROV. The vessel used during the project was the ACO Jessica Moore. Additional sensors included a Doppler velocity log, Digiquartz depth sensor, sound velocity probe, cPAP (LBL transceiver) and transponder.
Operations and timing
The mobilisation of the equipment took approximately 18 hours (the ROV was previously mobilised along with a survey computer for a previous job). The ROV operator created a bracket solution for the EM2040 Multibeam transducers at the rear of the ROV and additional sensors were mounted at other locations on the ROV.
As with most high accuracy mapping systems, calibrations needed to be performed prior to the operational phase. This included determining the Doppler velocity log (DLU) and inertial measurement unit (IMU) relative installations for the Hain inertial navigation system, which is done by the ROV performing a line with various speeds and headings. The time for this was about 30 minutes. In addition, the Multibeam needs to know the angular installation of the transducer head relative to the heading pitch and roll unit – in this case the IMU. This is calculated by the ROV performing a standard Multibeam patch test. The ROV took about two hours to complete this calibration. Both calibrations only have to be performed once. The portable Kongsberg HiPAP 351PI, in this instance mounted on the vessel, has an IMU in the head that provides heading pitch and roll to the system and thus does not require calibration.
The priority was to get an overview of the area measuring 1600m by 600m. No information of the area was given by the client except the presence of platforms that had been toppled or partially toppled – the exact location of each was unknown.
The initial survey was carried out at an altitude of 50m to obtain maximum coverage and to prevent the ROV from running into any debris. Five lines were run with an acquisition time of about six hours. From the initial results the toppled and standing platforms, and jackup footprints could be clearly seen. Partially buried pipelines can be made out in the surface but not distinctly, due to the relatively small surface protrusion (see Figure 1).
The sonar looks at the bottom reflection to find the depth but the intensity of the reflected pulse is also measured; often this is called backscatter. Displaying the backscatter instead of the depth information shows the pipelines with greater clarity. These initial views give the project engineer a clearer picture of what is on the seabed prior to defining the planning procedure (see Figure 2).
With the initial survey complete, the surveyor can now select areas to be viewed in greater detail. In this project the areas to be investigated included the platforms, debris field and pipelines. In addition to the bottom reflection and the backscatter, the sonar also records the water column data – the reflection that occurred in the water on the way to the seabed. Images of one of the toppled platforms, using water column data, were created by the ROV running three lines, one each side of the platform and one over the top. The data was acquired in about one hour and the data presentation was ready within 30 minutes. The client requested that the data was not cleaned to give a clearer indication of the system performance.
This illustrates the type of information a project engineer on such a job could have available within a short space of time to enable him to start planning operations. The pipeline survey was achieved with a single survey line run at a 10m altitude at about 1 knot. The purpose of this run was to ascertain whether the integrity of a pipeline could quickly be determined for position, buckling or freespans.
Additional detailed surveys of the debris field (Figure 3) and the other platforms (Figure 4) were also carried out. These data sets were lightly processed on the vessel, taking about 2-3 hours each.
Integration of navigation
While the acquisition of data is fairly rapid, the processing of high density Multibeam data is time consuming. The Kongsberg EM2040 data in this project was found to be extremely clean, thus requiring no or minimal processing and hence reducing costs.
All this data needs good navigation so that when the lines are mosaiced together they merge cleanly and all the data is geo-referenced. For this the HiPAP and inertial system provided the position directly into the Multibeam and the IMU provided all the attitude data (head, roll and pitch). With both systems being tightly coupled and interfaced into the survey DGPS no mismatches were found during data mosaicing. Further processing can be undertaken to determine the seabed classification and biomass analysis. If there were any leaks causing gas or oil plumes, these too could be detected and mapped in the water column data set.
Conclusions
The solution for this project was mobilised quickly and proved that data sets could be produced and presented in a short time scale. As all the data sets are geo-referenced, measurements and charting can be performed. The data sets can be converted into standard formats to be included into a company's GIS system. The integration of the navigation and sonar means that the complete system can be checked prior to transportation to the vessel. The Multibeam system is depth rated to 6000m and a low frequency HiPAP is also available to 6000m.
The navigation system on this project was rated to 4000m.
Further post-processing can be done to give 3D fly-through visualisation, analysis of water column biomass, seabed classification and true 3D scaled reference frames. An example of the water column post processing of this data set is shown in Figure 5. OE
 Subscribe