
As the energy transition accelerates, upstream companies are under pressure to decarbonize, and this is likely to intensify. Governments, investors, financial markets, society, along with other stakeholders are pushing for change. Companies need to define their strategy and act to future-proof their business and retain their social licence to operate.
There are strategic advantages to producing less carbon-intensive hydrocarbons. The market is shifting as some consumers look for a cleaner end product. We've started to see this with 'Green LNG,' but this will likely expand to cover other areas of the oil and gas industry.
The direction of travel is set. Early movers with 'cleaner' molecules will potentially be in a more advantaged position and rewarded by the market.
Future-proofing operations isn't only about gaining a strategic advantage. Governments will play a key role as they pursue their own environmental targets and goals, via tighter regulation and carbon pricing, for example.
The potential impact could be material. Wood Mackenzie’s analysis suggests that for the top upstream emitters – leading NOCs and Majors – a global carbon tax of $110/tonne, around the carbon price Wood Mackenzie estimates is required to limit the average global warming to two degrees above pre-industrial levels, puts up to a third of company upstream value at risk, with most of these portfolios in the 10% to 20% range.
The magnitude of the value at risk varies based on location, likelihood of carbon taxes, and intensity of the portfolio.
'Greener' operations not only offer environmental gains, but many of the steps are value accretive. Improving environmental impact can result in greater efficiency from production facilities, reduced leakage, and the capture – and monetization – of flare gas.
Many companies have already taken note, announcing bold commitments. Over 30 of the larger upstream players, including Majors, NOCs, and IOCs have set carbon reduction, net zero and/or scope 3 targets. Now, divesting out of 'dirtier' assets is one way to help meet these goals. But for many assets, especially those on production, this simply passes the problem down the line. What can operators do to reduce operating emissions if they want to retain their portfolio of assets?
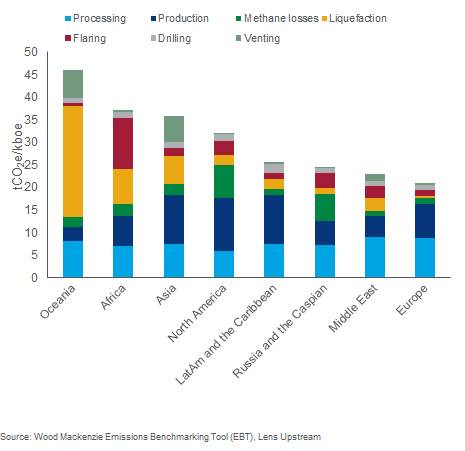
 Carbon Intensity by Region & Source: Average 2021-2025
Where do upstream emissions come from?
Emissions occur throughout the whole hydrocarbon value chain – from the wellhead to end-use. Some upstream companies are taking the bold step to tackle scope 3 (end-use), but the focus here is on scopes 1 and 2 at upstream installations. These are the operational emissions that upstream producers can control. Note that transportation emissions are excluded from Wood Mackenzie’s analysis, but oil and gas companies may include these in reported scope 1 and 2 figures if they are owners of the pipelines and/are tankers.
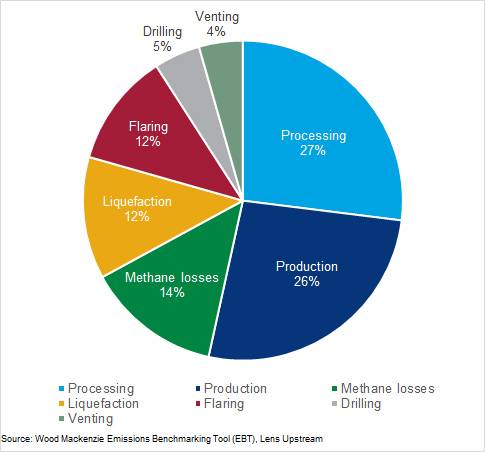
Wood Mackenzie split the sources into seven main categories – production, processing, drilling, liquefaction, flaring, venting, and methane losses.
Around 70% of emissions are produced to power operations – production, processing, liquefaction and drilling. Intensity is influenced by various factors.
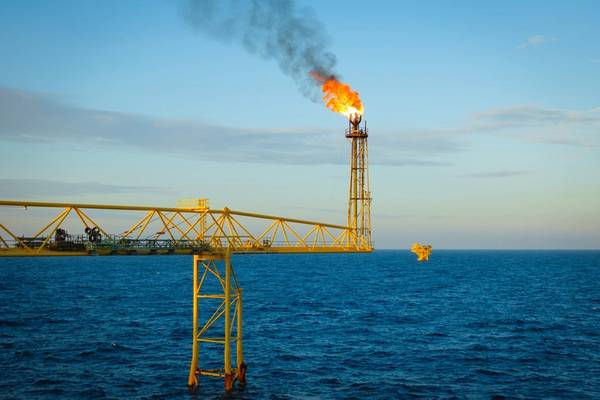
Flaring and fugitives (methane losses) are the second-largest contributor, with 26% of carbon emissions. Essential flaring is hard to avoid but, in some countries, large-scale flaring is a function of their dependence on petro-dollars from oil production. Associated gas is a by-product which requires disposal – flaring fits that need where there is no market for the gas. In others, transport infrastructure constraints can limit the outlet for product. Again, disposal may be a last resort.
Methane is the molecule that packs a punch – it is 28 times more potent than its carbon counterpart, according to the 5th IPCC Assessment Report. Release occurs from aging or 'leaky' kit – valves, compressors, pipelines etc, via incomplete combustion at the flare stack, and/or as part of a vented gas stream.
The final 4% is vented. These are the direct release of carbon emissions into the atmosphere. This can be due to separation, vaporization, or other routine operations. This includes those that have been stripped out of the hydrocarbon stream during processing to improve hydrocarbon quality or to meet specific requirements.
Each asset is different, so it will come as no surprise that there are regional variations when it comes to the intensity of oil/gas production. Oceania is heavily influenced by Australian LNG projects, high CO2 projects in Asia drive up venting, and aging infrastructure in the Caspian impacts methane emissions.
 Global Upstream Emission by Source: 2021-2025
Who are the biggest emitters?
Intensity allows a comparison on a like-to-like basis, but it will come as no surprise that it's mainly the large producers that contribute the most in terms of absolute emissions. The US, Russia, Saudi Arabia, Canada, and Iraq produce half of the global upstream emissions.
Canada is the slight exception in this group. Yes, its production is relatively high, but the main consideration here is the contribution made by oil sands where extraction and processing is such an energy-intensive process.
What are some of the solutions?
Solutions to reduce Scope 1 and 2 carbon emissions range in cost and complexity. There are the smaller-scale operational efficiency solutions and best practices, as discussed in the introduction. But the biggest gain will be from targeting power generation.
Low-carbon power
The majority of assets are powered by fossil fuels – using a portion of the produced hydrocarbons. Electrification allows operators to move to low-carbon power, either directly from renewables or by connecting to the grid where the grid mix is cleaner than the alternative fuel supply.
Norway is in an enviable position, with its power mix being predominantly hydroelectric power (90%+) – a renewable energy source without any corresponding intermittency issues. This, combined with the highest carbon taxes for E&Ps globally, has helped advance decarbonization efforts. By 2023, over half of Norway's production will be either fully or partially electrified. Wood Mackenzie estimates that once the Utsira High electrification project is brought online next year, Edvard Grieg offshore field’s carbon intensity will be sub 2 tCO2e/kboe. This compares to a global average of 24 tCO2e/kboe for offshore projects.
Alongside lower emissions, electrification can offer reduced maintenance, lower fuel requirements, greater uptime, and ultimately, free up more molecules for sale. But challenges do remain:
Flare reduction
Gas capture projects offer an option for the large-scale flarers to limit emissions. Such projects can offer economic, as well as environmental, benefits. However, there are barriers to entry:
The Basrah Gas Company's capture project in southern Iraq is a prime example of a development that is helping to reduce the volume of gas flared. At peak, over 1 bcfd will be captured from three of Iraq's super-giant oil fields – Rumaila, West Qurna One and Zubair. Associated gas that is otherwise flared as the country/government is highly dependent on its oil revenues.
Where projects are feasible, gas capture can provide an additional revenue stream for the companies involved, potentially greater income via taxes for governments and help satisfy unmet power demand.
Carbon capture and storage
Where carbon dioxide must be stripped from as streams to comply with infrastructure requirements, limited alternatives to venting exist.
Carbon capture and storage has become the frontrunner, with multiple operators across the Americas, Europe, Middle East, and Asia reviewing solutions. Although not widespread, there are existing projects online. The Sleipner project offshore Norway has been sequestering carbon for over two decades. But it is only in recent years that interest in CCS has taken off. However, CCS is still in its infancy, with many challenges to overcome.
What's next?
To date, the pace of decarbonization has varied from region to region. One of the key differentiators is the level of government support. Those with government-supported initiatives are achieving more than the regions that have a solely corporate-led strategy. As more governments set environmental and climate goals, we expect more of a push for upstream decarbonization efforts. Things can move relatively quickly, and companies don't want to be left behind.
However, nations that rely on hydrocarbon revenues may be slower to react. Wood Mackenzie’s analysis indicates that the risk of policy change is greatest for producers operating in the developed economies. Will we see a divergence between the developed economies and those that are reliant on petro-dollars? Are all the big producers onboard, or will a 'carbon chasm' form between the OECD and petro dependent nations?


