Accurate monitoring of oil and gas production is an increasingly valuable tool for operators and surveillance engineers but, until recently, visibility of data has been almost exclusively available to on-site operators.
For those involved in remote surveillance and decision support, the ability to visualize data and interpret an asset’s performance in real-time has been a significant hurdle.
 Ninety percent of the digital data currently in use in the world has been created in the past two years1. The oil and gas industry is rapidly realizing the benefits of operational intelligence (OI) systems to monitor and improve asset performance.
Meaningful monitoring
Intelligent monitoring systems, such as those supplied by Xodus, enable information from the asset’s data historian to be available to engineering and management teams by creating interactive visualization tools. Information from the asset is not only displayed in real-time, it can also be used to calculate inferred data not recorded in the historian. This can then be visualized even where no physical instrumentation exists, for instance, via the creation of virtual meters for a process stream which has no flow meter, or where a meter already exists but requires a metric for drift in calibration.
Some of the tools already created include prediction and visibility of heat exchanger fouling, compressor and pump performance monitoring, and subsea production monitoring. Other tools include high-level overview/management dashboards which are permanently displayed in client offices for personnel to view the current and recent health of the asset often using a simple traffic light system.
The tools are typically created remotely via secure virtual connections and are seamlessly implemented online to the client’s system for immediate access to all users. These solutions are relatively low cost, with short lead times and swift returns on investment. The benefit to the customer of using secure virtual connections are several fold but include the fact the work can be executed independent of location or timezone and without requiring access to valuable desk space in the customer’s office. Such applications have been successfully implemented remotely from across the continent and, in some cases, across the globe.
 Increasingly sophisticated levels of OI are becoming more and more prevalent in the oil and gas industry. Woodside’s North West Shelf offshore assets, the North Rankin Complex and Goodwyn Alpha, now employ Xodus Group’s start-up sequence visualization tool. It monitors systems coming online during a restart and displays key start-up status indicators from around the process and utilities systems. Crucially, it allows the surveillance team to monitor the asset start-up sequences proactively. Additional information can also be calculated from the monitoring sequence to determine how much downtime is associated with a particular activity enabling it to be logged for further investigation.
The popularity of these systems has been evident since, once their benefits have been demonstrated on one asset, they have been enthusiastically adopted across many assets of a business. Woodside assets Okha, Ngujima Yin, Angel and Persephone are amongst others now successfully adopting the technology. Xodus is observing a similar trend with several other key customers.
Xodus has also created powerful performance and degradation monitoring tools for production critical equipment such as gas export compressors on other Australian projects. The tools leverage historical data to determine how the equipment is performing relative to known historical operating conditions and can identify degradation of mechanical components which causes a reduction in throughput, a decrease in efficiency, or an increase in power consumption.
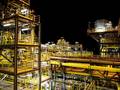
 The compressor and other process parameter monitoring dashboards for Woodside’s North Rankin Complex (pictured right, image from Woodside), for example, consolidate average operating values across a period of 24 and 48 hours to provide indications of where within the integrity envelope the asset’s equipment has been operating. This provides surveillance engineers with a means to assess any excursions towards alarm limits and take preventative action for future excursions. With access to the assets’ data historian and the facilities' production and design documentation, Xodus can create many other intelligent calculations to monitor such things as triethylene glycol (TEG) column performance (figure 3), pump performance, operating and integrity envelopes, alarm and trip history, and heat exchanger performance and fouling.
Whilst dealing with terabytes of seismic data is now commonplace, the industry is only just beginning to realize the value that can be generated by fully exploiting the hundreds of simulations and tens of thousands of sensors that make up a large modern field development. Improved monitoring ultimately leads to faster response and significantly less downtime.
1. www.sciencedaily.com/releases/2013/05/130522085217.htm
Andrew Jones is Digital Asset Manager for Xodus Group, Perth, Australia and is a process engineer with 22 years’ experience in the chemical, nuclear and oil and gas sectors in varying locations worldwide. He graduated from the University of Nottingham, UK in 1994 with an BSc (Hons) in Chemical Engineering.
 Subscribe