Himanshu Maheshwari and Bulent Mercan, of 2H Offshore, discuss how a well-designed integrity monitoring program provides data for riser digital operations.
 |
|
Fig 1: Large gap between predictive analysis and reality. Images from 2H Offshore. |
Machine learning, edge analytics, big data, cloud infrastructure, the internet of things (IoT). The offshore industry is starting to embrace digital technologies for drilling operations and condition-based maintenance (CBM). These technologies are of little use without data from subsea assets to drive them. A well-designed riser monitoring system will allow operations managers to access that data and harness these technologies to make knowledge-based operational decisions.
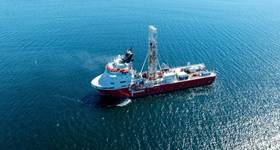
Deepwater drilling risers are often deployed in harsh offshore environments in water depths >1mi. In most cases, limited sensor data from the seabed and rig is used to help manage operations.
We are also pushing boundaries with deeper water depths, harsher environments, high-pressure, high-temperature (HPHT) reservoirs and drill floor automation, which makes riser operations increasingly challenging. Whatever the offshore conditions, developing a smart riser monitoring framework that reduces risk, increases safety and facilitates operational decision-making, requires careful consideration and planning in combination with data analytics and leading edge technologies.
Maximizing the value
 |
|
Fig 2: Condition-based riser maintenance. |
Data driven decision-making is critical in today’s market because the industry can no longer afford wastage on sub-optimal design tools. The drilling industry traditionally relies on numerical analysis tools to assess the structural integrity of riser components for fatigue and operating envelopes. The riser engineer provides the analysis results based on pertinent industry best practices and codes. These design provisions include high safety factors in order to account for the variability of the environment, soil, weld quality, material properties and hydrodynamic characteristics. This overly conservative approach with a safety factor can delivers results that are less than realistic (Figure 1), which could result in reduced operability.
Scheduled drilling riser joints inspection is another major expenditure for deepwater drillers. The high cost of logistics, inspection and re-certification of each joint affects the bottom line. CBM is accepted by regulatory and certification agencies as an alternate to the scheduled inspection. A strategic riser monitoring program backed by a robust data management process is an effective tool for CBM. The monitoring program effectively tracks the usage and loading on each riser joint to ensure against early failure and allows more accurate inspection frequencies as shown in Figure 2.
As the drilling industry settles into a “new normal,” riser monitoring, data aggregation and digital data analytics offer significant opportunities for operators and drilling contractors to reduce costs and increase uptime.
Be clear on monitoring objectives
 |
|
Fig 3: Reduced number of sensors with advanced field data analytics. |
A monitoring system configured for CBM can vary greatly from one configured to increase operating windows, so it is important to specify monitoring objectives early in the project. Are you operating in high currents or high seastates? Is fatigue hot spot tracking required? Is there any need for a flex-joint limit assessment? Perhaps the concern is wellhead fatigue accumulations during high currents. With an understanding of what data needs to be collected, the system can be optimally designed and the most suitable sensors selected. Focusing on a cutting-edge sensor or platform instead of the key objective is a common but crucial mistake.
System engineering requires a detailed understanding of riser dynamics, instrumentation, and data analytics. There are a multitude of ways to configure a riser monitoring system and carry out the data analytics. Selecting the most appropriate approach depends on a number of factors, for example, environmental conditions, riser response, data acquisition access and data analytics considerations. Knowing which approach to use in what conditions is essential to achieving a reliable, low cost system.
Selecting the system
 |
|
Fig 4: Standalone, acoustic, hardwired (wireless coupler), and hardwired configurations. |
Drilling riser response is typically monitored by high precision motion or strain sensors specially built for subsea. Motion sensors allow global response measurement, whereas strain sensors provide direct stress measurement at fatigue hot spots.
Sensors can be mounted equally spaced along the length of the riser, Figure 3 (a), but the cost of such a system would be very high due to the number of sensors needed.
Using fewer sensors in clusters at the top and bottom of the riser stack in the fatigue hot spots, Figure 3 (b), provides equivalent value in terms of data, but at less cost. Further savings can be achieved by reducing the number of loggers as shown in the configurations in Figure 3 (c) and (d) and using advanced data analytics.
Optimizing data transmission
Subsea data transmission requires expensive hardware. For a real-time riser monitoring system, data transmission is a major cost and schedule driver. Advanced planning goes a long way to assure a reliable system.
Standalone sensor packages with battery packs have been used as a cost-effective solution for riser monitoring as shown in Figure 4 (a). Standalone loggers deployed or retrieved by ROV have the least interference with drilling operations. They can be used to track fatigue and help with CBM. Standalone configurations are limited in providing operational support because recorded data is only available for analysis at the end of a monitoring campaign.
Acoustic sensors are better for near real-time monitoring and operational decision making as shown in Figure 4 (b). They have been extensively used in deepwater environments. Due to the small bandwidth, the acoustic communication systems can only achieve low data rates and suffer from low propagation speed, severe channel variation, and environmental interference. Acoustic data communication is more suitable for small data sets (e.g. motion spectra instead of time signals). Nano apps are used to process data on acoustic systems to reduce the size and frequency of transmission.
Hardwired systems offer real-time data access as shown in Figure 4 (c) and (d). A data cable can be installed along with a MUX line to integrate a number of sensors along the length of the riser. A wireless coupler is used for data access at each joint. As an alternate, short length cable near the top and bottom can be used to measure strategic locations and are extrapolated with analytics.
Applying advanced data analytics
 |
|
Fig 5: Data analytics; (a) transfer function method (b) analytical method and (c) mode matching method. |
Data processing tools can run on a sensor package or can analyze aggregated data on the rig for real-time assessment. Nano programs running on advanced sensor packages can greatly reduce the data transmission and power requirement leading to cost savings for acoustic systems. Triggers can be set to alert for events that require immediate attention. Real-time data aggregated on the rig is analyzed and published to provide operational guidance. The analytics can be as simple as trending, thresholding or spectral assessment. Careful attention should be paid to signal processing and analytical methods based on the sensor scheme, data transmission and riser response. Apps use various data analytics and transfer functions correlating measured data with riser response in demand.
Measured riser response at the sensor location can be correlated with responses at a distant riser location using transfer function methodology, as shown in Figure 5 (a).Finite element analysis (FEA) is performed to generate transfer functions for critical locations. This method is very cost effective as it requires data from a single sensor. However, the accuracy of the results will be compromised due to its FEA dependency.
The analytical method is independent of FEA and offers more accurate results. This method relies on analytically derived transfer functions correlating measured accelerations to curvatures at the sensor location, as shown in Figure 5 (b). Fatigue accumulations can be calculated at the sensor location.
The mode shape matching method is used to determine riser fatigue due to vortex induced vibrations. This method uses the modal amplitudes and frequencies fitting best into the measured riser response at various logger locations, Figure 5 (c). The result will require a number of sensors distributed along the riser in order to properly capture the riser excitation modes in the field.
 |
|
Fig 6: Riser digital operations. |
Embracing digital operations
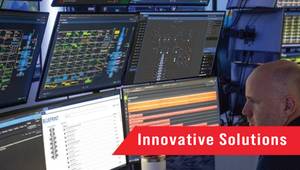
Digital operations help achieve dramatic improvements in productivity and efficiency by using data driven decision making from the rig floor to the command center. An example of riser digital operation system architecture is shown in Figure 6.
Typically, data from a number of sensors and devices including riser monitoring, environment, vessel motion, riser response tracking and in-between well joint inspections is stored on board the rig. A large number of operations fail to leverage from this data as it is stored in separate databases.
Edge analytics tools allow for data collection and analysis in which an automated analytical computation is performed on data at a sensor or on board rig database. Smart sensors and devices trigger raw or processed data transfer based on events to prioritize rig network resources and manage risks. Onboard data aggregation and real-time analytics will then provide insights into ongoing operations. A carefully designed user interface will deliver real-time feedback giving a realistic view of the operating envelopes, alerts and tracking of critical operations.
Rig personnel can access flex-joint angles, riser tension, rig offset, riser displacement/shape, environmental data, and fatigue damage rate tracking displayed along with their safe working limits. In addition, they can get real-time advisories for optimal tension and vessel offsets to stay within operating envelopes and reduce damage to the riser system.
At the command center, field data from multiple rigs are aggregated through cloud infrastructure for big data analytics. It includes a collection of field data recorded during operations at different water depths, environments and fields. Aggregated data sets can be used to develop more reliable predictive models with machine learning.
Machine learning is based on algorithms that can learn from data without relying on rules-based programming. Having access to input data and results facilitate training algorithms leading to improved predictions. Specialist apps can be used to calculate key parameters related to weld crack growth, wall thickness, sealability, corrosion and model calibration.
Riser monitoring systems should be designed with the combined understanding of end results, system response, data analytics and instrumentation. In turn, digital operations can uncover patterns from big data sets resulting in closing the gap between numerical analysis and reality; allowing increased uptime, providing smart stack-ups for fatigue management, delivering early warning for impending risks and facilitating CBM to optimize inspection frequency and extend asset life.
 Himanshu Maheshwari is a senior project manager at 2H Offshore in Houston. He has over 10 years’ experience in the industry and specializes in riser integrity management, monitoring and data analytics.

Bulent Mercan is an engineering specialist at 2H Offshore. He has a PhD in civil engineering and over five years’ experience in riser engineering, monitoring and data analytics.
 Subscribe