Alternate probability distributions could provide a better fit for Arctic ice gouge depth data, impacting design depths for future subsea pipeline projects.
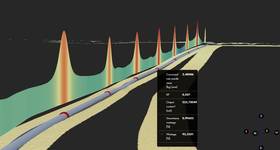
Pipelines installed in ice-prone regions require specialized designs for the unique environmental conditions. When the keels of icebergs and ice formations impact the seabed with sufficient driving force, the seabed can be disturbed, leading to seabed deformations called ice gouges or ice scours (Fig.1).
In a paper presented to the International Society of Offshore and Polar Engineers, INTECSEA studied extensive repetitive seabed ice gouge data collected along the Northstar pipeline route in Alaska’s Beaufort Sea. The route has been surveyed for multiple years, both before and after the pipeline bundle was installed in 2000.
Probabilistic assessment of ice gouge depth statistics has been utilized to predict extreme ice gouge depths. Beginning in 1977, single parameter exponential distributions were shown by researchers to be effective, but conservative, in predicting design gouge depths. Exponential distributions, however, have generally been used to describe time-based events, such as waiting times or queuing problems.
Later research examined the use of different probability density functions and found the Weibull or gamma functions to more accurately fit ice gouge depth data from the Beaufort Sea. Other research investigated data specific to the Northstar pipeline route and found the lognormal distribution more accurately fit the historical data set.
After examining data available from the Northstar Development Annual Pipeline Route Monitoring Program annual survey reports, INTECSEA concluded that the lognormal distribution (Fig. 2 and 3) provided the best fit. In water depths less than 4.9m (16ft), a 3-parameter lognormal distribution was marginally better (Fig. 2).
 Analysis using observed maximum annual gouge depths only was also investigated. Comparative analysis using all available, known-age gouge depth data vs. known age annual maximums shows that analysis of maximum gouge depth data could lead to over-conservatism in design.
Image Caption: Fig. 1: Schematic representation of an ice keel event over a pipeline.
Analyzing a dataset containing only the single deepest ice gouges observed annually in a survey area did not reflect the true statistical ice gouge distribution crossing a pipeline route centerline.
Another key finding was the importance of repetitive mapping programs. Using similar equipment and procedures each year brings improved extreme event gouge depth prediction accuracy. INTECSEA suggested that additional evaluation of subgouge seabed deformation and active gouge infilling is merited to diminish gouge depth uncertainty and provide a better understanding of icesoil- pipe interaction. Having confidence in statistical models from multiple years of regional survey evaluation can reduce conservatism in predicted extreme gougedepths, potentially resulting in reduced trenching and burial costs for Arctic and harsh-environment pipelines.
The impact of ice gouges
Ice gouge protection typically involves trenching and burying the pipeline to some depth below the maximum ice gouge depth to protect the pipeline from direct contact and to mitigate subgouge soil displacement bending strains.
Annual variability in the ice gouging regime may be a significant factor in defining the design depth. Increased summer open water fetch lengths may contribute to driving multiyear ice floes into shallow waters and create deeper gouges.
Predicting the original gouge depth at the time of the event is often problematic since the gouges are not measured while the ice keel is moving and deforming the seabed. These measurements are often taken sometime after the event has occurred using summertime seabed surveying techniques and instrumentation, such as sidescan and multibeam sonar.
This makes measuring or predicting the initial gouge depth difficult since weathering and natural backfilling or sedimentation can occur post-gouge. This alters the record preserved on the seabed. However, when studies are performed over multiple years, previously observed gouges can be remeasured and the amount of backfill that has occurred can be compared.
Tracking known ice gouge occurrences also allows for better predictions. The depth and backfill amount also are dependent on the region’s physical, environmental and ice regime characteristics.
A pipeline is not affected by ice gouges that do not cross it and this must be addressed when defining the design gouge depth. Additional factors can influence a pipeline’s response to seabed ice gouging including pipeline operating conditions; seabed soil characteristics; gouge width; gouge orientation with respect to the pipeline; trench backfill conditions; and detailed interactions between the pipe, soil and ice keel.
Studying the Northstar pipeline system
 The BP Exploration (Alaska) Northstar offshore Arctic pipeline system was installed as a bundle and includes a nominal pipe size (NPS) 10-in. oil export pipeline and a NPS 10-in. line supplying gas to the field for reservoir pressure maintenance. These pipelines extend outside the Alaskan coastal barrier islands and are exposed to more significant seabed ice gouge conditions than two other subsea Arctic pipeline systems operating in the Beaufort Sea.
Two primary load conditions controlled design and trenching requirements: ice/seabed interaction in the deeper water zone outside the coastal barrier islands, and seabed permafrost thaw subsidence in the shallow lagoons.
Seabed ice gouging was observed from 1995 through 1999, during each of the yearly pipeline route bathymetry summer surveys carried out before construction. Since installation, there have been 12 yearly surveys conducted. At the time the BP Northstar design was completed in 1998, there were a total of 8 years of seabed ice gouge survey data in the vicinity of the pipeline route.
Limit state design procedures for pipe bending were used to calculate the minimum pipeline depth of cover to resist ice keel loads. A 2.13m (7ft) minimum depth of cover was calculated based on a 100-year return period maximum ice keel gouge depth of 1.07m (3.5ft) using an exponential gouge depth distribution. The minimum depth of cover ranged from 1.83-2.74m (6-9 ft), depending on location.
INTECSEA studied three sets of data – the annual pipeline route monitoring surveys performed by Coastal Frontiers Corporation (CFC) along the route between 2000 and 2011, the entire set of CFC surveys conducted along the route between 1995 and 2011, and the full set of all available ice gouge data from all surveys in the area. These data sets were further divided at the 4.9m (16ft) water level for consistency with the original design analyses. The ‘All Data Sets’ collection included gouges of both known and unknown age whereas the two collections of Northstar-specific data included only new (or known age) gouges. The qualitative goodness-of-fit of investigated probability distribution functions (PDFs) was assessed by comparing them against both the ice gouge depth data distribution histogram and the ice gougedepth empirical cumulative distributions (see Fig. 2 and 3). Where qualitative assessment could not distinguish the best fit, final selection of the PDF was based on an Anderson-Darling (A-D) test. The maximum ice gouge incision depths observed along the route centerline plus two, or more, offset survey lines are recorded annually in the Northstar Development Pipeline Route Monitoring Program reports that are available to the public.
Surveys use sidescan for ice gouge detection, with a range of 50m on either side of the survey vessel trackline (100m swath width). Multibeam sonar is then used to map identified ice gouges with effective swath widths ranging from 7.6 to 42.7m, depending on the water depth and returned acoustic beam signal.
The surveys in 2007 and 2011 showed very significant seabed gouging during the preceding 12-month period. INTECSEA reported that an intense storm during October 2006 produced high winds, waves and a negative storm surge, while multiyear ice floes were present near the pipeline route.
The deepest observed 2007 ice gouge was 1.55m (5.1ft), exceeding the 100-year design ice gouge depth by a factor of 46%. However, the 1.55m (5.1ft) deep ice gouge observed in 2007 was located 55m (180ft) east of the pipeline centerline. The maximum gouge depth observed directly above the pipeline that year was only 0.24m (0.8ft).
The 2011 survey reported 130 new gouges – more than double the previous highest record of 54 in 2002 – but no gouges exceeded the 100-year design ice gouge depth. The deepest ice gouge observed in 2011 was located near the pipeline centerline, but not directly over top of the pipeline and did not reduce the minimum trench backfill soil thickness above the pipeline.
Going forward
INTECSEA’s research shows that having confidence in statistical models from multiple years of regional survey evaluation can reduce conservatism in predicted extreme gouge-depths, potentially resulting in reduced trenching and burial costs.
INTECSEA concluded that since many years of site-specific seabed ice gouge data will not be available for new pipeline projects, a balanced approach towards defining reasonably conservative (deeper than expected) design gouge depths and other design parameters affecting the pipeline safety is warranted. OE
Jonathan Caines is a pipeline engineering specialist and manager of small projects with INTECSEA Canada in St. John’s, Newfoundland. Caines holds a B.Eng. in Mechanical Engineering and an M.Eng. in Oil and Gas Engineering, both from Memorial University of Newfoundland.
 Subscribe