|
| Scanning electron microscope(SEM)imaging and analysis offers 2D and 3D images to visualize texture and pore connectivity in unconventional reservoirs. |
Schlumberger's CoreFlow services combine both physical and digital analysis to reduce lab time from months down to days, and even hours. Audrey Leon spoke with Schlumberger's Mark A. Andersen to find out more.
Schlumberger introduced CoreFlow digital rock and fluid analytics services as its core analysis laboratory in northwest Houston in December 2013. The lab builds digital rock models for carbonates, sandstone and shale, and examines pores and grains at the micro- and nanometer levels, providing digital views of flow characteristics.
The lab is not meant to replace physical analysts, but complement it, says Mark A. Anderson, Schlumberger Head for Core Physics and Manager of the Digital Core Analysis group at the Schlumberger Laboratory in Houston.
“By having both physical and digital analysis in the same building we have all the material to make the comparison and help the client get more complete answers,” Andersen says.
The process
The whole-core method uses samples that are captured from the reservoir that are typically 4in in diameter and up to 3ft long. Schlumberger uses a helical whole-core dual-energy CT scanner to scan cross section slices of the rock sample until the whole core is captured. The images from these samples are then used to construct a slice-by-slice 3D movie.
“This is valuable, the ability to look at recovery of the rock without taking it out of the liner,” Andersen says. “You can do CT imaging in the liner, leaving the rock untouched. Scanning gives us a sense of core recovery – what’s the quality? If the rock is friable, it may not stand up well to mechanical shaking involved in transport. CT scanning allows us to determine if the core analysis can continue as planned. ”
“The initial CT scan allows identification of different rock types,” Andersen says. “If you do one energy scan, you correlate to the bulk density of the sample.
Addition of a second energy level provides information about the effective atomic number; from that we can back out chemical information that indicates mineralogy,” he says.
Another component of the rock analysis is the heterogeneous rock analysis (HRA), which allows the system to type similar rock characteristics, and label them by color. This helps to obtain more information from limited sample quantity. “If I think the black-labeled sample type is important, HRA coding guides us in sample selection and also for physical analysis,” Andersen says.
The next step is the microCT scan, another X-ray method. Here the typical sample size can be 8mm in diameter. The X-rays shine through the samples to get a backscatter image. Then the lab technicians will rotate the sample a 10th of a degree and take another image, eventually ending up with 3,600 backscatter images, which helps create a 360-degree view.
“What we do next is a mathematical inversion, computing tomography based on the backscatter images, and end up with a 3D image of the rock,” Andersen says. The process gives a 3D volume with a resolution of 1-2 microns on a side. Andersen says this is important with conventional rocks such as sandstones and carbonates. Unconventional materials will need a higher resolution in the nanometer range.
 |
| Schlumberger uses samples of various sizes for physical and digital core analysis. |
SEM analysis
In order to get to that higher resolution, SEM (scanning electron microscopy) imaging must be conducted. SEM provides a higher level of magnification including 2D and 3D images. First, the sample surface is flattened using argonion mill and later imaged. The 2D images show features of the flat surface, but the 3D images can identify pore connectivity.
For 3D imaging, the ion beams are an integral part of the SEM machine, Andersen says. “You select a portion of the surface, take the image; mill it and take another image, and as you mill into the sample, you’re getting a 3D volume,” he says. This provides a representation that is 100 microns across, about the diameter of a human hair, Andersen says. This is needed to see the pore spaces in mudstones.
This type of image analysis can measure porosity and both organic and mineral content. The surface of the sample could be as large as 25mm by 15mm. “This is small but in SEM, this is a huge amount of real estate,” Andersen says.
The higher resolution provides detailed information about the pores, which is important because their location and the shape help determine what is a good pay zone for the client, Andersen says.
DHD Simulator
What’s different about Schlumberger’s approach, Andersen says, is the DHD (direct hydrodynamic) simulator. This takes the volume representation of the rock and simulates flow, allowing engineers to see how fluid flows through the pores. “The simulator uses a model of the fluid, captures the physical and chemical features such as surface tension and viscosity,” he says. “What’s truly unique about our simulator is it utilizes realistic pore geometries and fluid characteristics.”
“The DHD simulator allows us to do what no one else can do,” Andersen says. “We can model behavior of the fluid and answer specifics to the client’s reservoir and reservoir conditions.” This can be done multiple times on the same digital rock model, representing behaviors at any distance near or far from the wellbore, he says.
 |
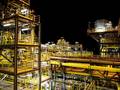
| Schlumberger Reservoir Laboratories evaluate rocks and fluids around the globe. |
The physical principles in the DHD simulator go all the way back to the 19th century, Andersen says. However, relevant work began almost 20 years ago with a research scientist in Moscow. That scientist started working for Schlumberger and began development on the simulator approximately five years ago.
Schlumberger teamed up with Shell to validate the simulator’s fluid properties and interactions. Shell used a synchrotron- based x-ray computed micro-tomography (results presented in two papers at the International Symposium of the Society of Core Analysts in September 2013). The analysis showed where flow of treated fluid entered a pore. Using the same starting point, the simulator was able to predict where the fluid flowed.
“The two images were very similar,” Andersen said. “You’d think it was the same picture.”
The Future
Physical analysis won’t ever go away, Andersen says. “The combination of digital and physical core analysis is more powerful than either alone. Physical analysis is a proof point that people have been obtaining for decades. It will be a long time, if ever, before petrophysicists are willing to bypass the laboratory work. What is likely to happen,” he says, “is that the balance of emphasis between the two is likely to shift with time toward additional digital analysis.”
 Subscribe