While UK North Sea production efficiency has made improvements since diving to a dire 60% in 2012, more can still be done, says Gordon Lawrence from Asset Performance Networks.
 |
|
Image from iStock. |
Production efficiency has come under the spotlight on the UK Continental Shelf (UKCS) – and not for good reasons. Even before oil prices collapsed in mid-2014, the watershed Wood Review found that “Production efficiency... has fallen from 80% a decade ago to 70% in 2010 and to an average of 60% in 2012.”
The Wood Review cited poor asset stewardship and “poor project management, planning and execution efficiency...” as contributors to this efficiency loss. Oil & Gas UK’s Efficiency Task Force determined that most of the production loss referred to in the Wood Review could be attributed to “unplanned plant losses and planned shutdowns...” It subsequently issued a pamphlet offering “Guidance for the Efficient Execution of Planned Maintenance Shutdowns.”
In June, the Oil and Gas Authority (OGA) published the UKCS Production Efficiency in 2016 report. It finds that production efficiency – measured as the percentage of production compared to the maximum theoretical production of an asset – has now risen to 73%. But, this is still far below an 80% target and the report highlights that “Plant losses continue to be the largest loss category in 2016, representing 60% of total losses.”
Research carried out by Asset Performance Networks indicates that there are a number of areas where plant losses could be reduced by transferring lessons from onshore maintenance turnarounds to their offshore counterparts.
Extending intervals
Historically, much of the offshore industry has focused on 12-month intervals between turnarounds. One exception to this has been West Africa, which focuses more on 48-month cycles. But, in the last decade, there has been a trend, particularly in the Norwegian sector, and more recently in the North Sea, to try and stretch the interval from 12 to 24, 36, or even 48 months.
However, there are obvious, practical limitations to how far the interval can be extended, including:
As efforts to extend intervals offshore continue, operators are coming up against another limitation, which has a significant impact. The North Sea industry has been developing and expanding for about 50 years. Numerous firms operate different assets, including platforms, pipelines, distribution hubs, treatment facilities, and onshore receiving stations. Over time, these assets have become more and more interconnected, to the point where the shutdown of any one asset for maintenance can have a significant “knock-on” effect on the other, interconnected assets.
The next concern with extending the interval is whether, by extending it, the turnaround duration is increased by an unacceptable amount. Data from the Asset Performance Networks databases indicate that the duration does appear to increase, by about 15%, when one moves from a 12-month interval to a 24-month interval. But considering that one has just doubled the interval, this seems a relatively small increase in duration. On an annualized basis, a turnaround of 26 days each year versus a turnaround of 30 days (15% longer) every two years represents the asset being shut down for 7% of the year versus 4% of the year. The advantage of extending the interval appear to be outweighed by increased turnaround duration.
 |
|
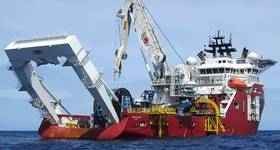
Scope change after scope freeze. Figure 1: Onshore Facilities. |
Reducing scope
As well as extending the turnaround interval, an obvious step in reducing production loss is to reduce the duration of the turnaround itself. This can be by focusing only on scope that is “necessary” for safe and uninterrupted operation and deleting “discretionary” scope.
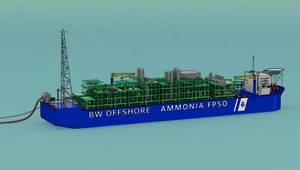
Data gathered by Asset Performance Networks indicates that offshore turnarounds tend to include significant “discretionary” scope. Figure 1 shows the average volume of scope added to onshore turnarounds after scope freeze and before the turnaround, as well as scope “discovered” during the turnaround. Figure 2 gives the equivalent data for offshore turnarounds. This data shows that there is a significant “reduction” in scope during the execution of offshore turnarounds. When interviewed about this reduction, offshore teams explained that they had “discovery” work, just like onshore turnarounds. However, offshore they were able to cut discretionary scope to not only accommodate the discovery work, but also to ensure that the turnaround duration was not excessively threatened. This is clear evidence that offshore turnarounds contain a lot of “discretionary” scope.
A decade ago, the onshore industry also had a culture of pushing “discretionary” scope into the turnaround. They managed to move away from this attitude by implementing some changes. Firstly, they communicate a tight focus on what the turnaround is intended to accomplish. A very specific and clear “premise” document defines why the turnaround is needed. This naturally leads into a clear definition of the criteria for including scope in the turnaround. In the upstream industry, this premise document is generally not written in as clear a manner as those in the refining industry. Offshore premise documents tend to focus on total shutdown duration, no accidents, and other lagging performance indicators. What is missing is a clear definition of “why” the shutdown needs to take place and hence what scope is “necessary” vs. “discretionary.”
Secondly, the onshore industry has begun using Risk Based Scope Review (RBSR). Prior to freezing the scope, all scope items are “challenged” on whether they meet the scope criteria and, in the case of preventive maintenance, on whether the cost of including the item in the turnaround is less than the risk of it breaking during the subsequent turnaround interval, coupled with the lost production and cost of repairing it when it breaks. Asset Performance Networks has helped teams to reduce scope by typically 10% to 20% using this method. Offshore teams tend not to have the same rigor in challenging scope and the tendency is to include scope based on personal preferences and say-so. After both these actions, onshore teams retain their gains by ensuring that the scope control process, post scope freeze, is rigorous and firmly enforced.
 |
|
Figure 2: Offshore Facilities. |
Changing the goal
The focus on scope encourages onshore teams to ask, “How much time do we need to implement this scope of work?” Conversely, many offshore teams still focus on, “How much scope can we implement in the time given to us?” This attitude is inadvertently enabled and encouraged by the fact that the offshore turnaround duration is rarely set by the team based on the scope of work. Rather, the durations for offshore turnarounds are generally imposed on the turnaround team by senior management and are based on market expectations, not on practical, scope based need.
The path forward
It is the view of Asset Performance Networks that addressing the following issues could have a major impact on production efficiency in the North Sea.
 Gordon Lawrence is the manager of Capital Project Consulting in the Amsterdam office of Asset Performance Networks. He is a chartered engineer, a registered engineer with FEANI and a Fellow of the UK Institution of Chemical Engineers. He holds degrees in chemical engineering, biochemical engineering and business administration, with over 30 years’ experience in project management and maintenance turnarounds in the process industries.
Efficiency guidelines
Industry guidelines designed to boost production efficiency in the UK Continental Shelf have been published by Oil & Gas UK.
“Guidelines to Maximise Compression System Efficiency” aims to address gas compression losses, which accounted for more than 40 MMboe in unplanned production losses in 2015.
The document, devised by the Production Efficiency Task Force (PETF), sets out recommendations and good practice for improving compression system performance, covering areas such as:
It is recommended that companies have a “lessons learned” process to ensure continual improvement of maintenance procedures. A basic review would involve an assessment carried out after the execution of each maintenance activity, improving efficiency by providing a real-time response to any issues which arise.
PETF chairman and Operations Director of North Sea Midstream Partners Matt Nicol said: “We have made great progress but still have more to do to achieve the PETF’s 80% production efficiency target. I encourage all operators to utilize this gas compression best practice guide.”
 Subscribe