The effective development of low-permeability tight gas reservoir resources requires operational efficiency to improve production performance. Erik Schrama, Robin Naughton-Rumbo and Fred van der Bas, Shell; Josef Shaoul, Fenix Consulting Delft; and Mark Norris, Schlumberger discuss the North Sea’s first true tight-gas horizontal well fracturing application.
Since its discovery in 1986, a tight gas field (average reservoir permeability below 0.1mD) in the Dutch sector of the North Sea has undergone several well developments aimed at draining the reservoir at sufficiently high and sustainable rates. These developments, which included drilling a deviated appraisal well and fracture stimulating the first horizontal development well, gave initial production rates ranging from 0.2 million Nm3/d to nearly 0.09 million Nm3/d. However, factors such as liquid loading soon brought the production rates down to the range of 0.07-0.09 million Nm3/d.
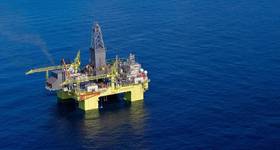
Drawing on the lessons learned from these previous drilling campaigns, Shell, Schlumberger and Fenix Consulting Delft joined forces in 2008 to drill a horizontal sidetrack and place five hydraulic fracture stages to effectively drain the reserves in the block.
This article reviews the drilling and fracturing operations in the development of this well, including the fracture design methodology, operational issues, post-fracturing production analysis (with more than one year of production history) and a production forecast.
 Table 1. Principal items of equipment on vessel.
Drilling the sidetrack
The well was drilled with an oil-base mud, but large washouts were seen in the shale sections (up to 10in in shales vs 6in in sandstone), which was also experienced in the vertical wells. Due to the shape of the reservoir and the location of the field with respect to the platform, the well was drilled in the direction of maximum horizontal stress, such that the fractures were longitudinal. A 1.5km long horizontal reservoir section was completed with a 41/2in cemented liner with advanced flexible cement technology to minimize the effect of pressure and temperature cycles. The well was completed with 51/2in x 5in Cr-13 production tubing, which was selected to allow for high pumping rates and running of composite bridge plugs (as a contingency for sand plugs).
The fracturing plan
The key parameters in the fracture design were the fracture height, which should connect with the various reservoir sections that are separated by a thin shale layer, and fracture conductivity. The shale layer acts as a barrier for gas flow, but does not contain the fracture height growth. Inflow modeling suggested that the orientation of the fractures is longitudinal compared with the well trajectory. The distance between the fracture initiation points is around 200m. It also showed an optimized fracture half-length of about 50m, which should prevent potential interaction between the fractures. The fracture geometry will be radial shape.
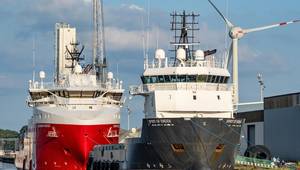
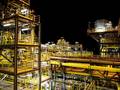
 The Olympic Princess during fracturing operations in the North Sea.
The selected fracture treatment includes a delayed borate crosslinked gel and coarse resin-coated proppant (16/20 mesh intermediate strength proppant) at a target average concentration of 2.5-3lb/ft2, which is a common fracturing treatment in the North Sea. This high-viscosity fluid, combined with the designed pump rate of 25bpm, enhances fracture height growth.
Several components were brought together to conduct this operation.
A specially converted platform supply vessel (PSV) to serve as the stimulation vessel. The Olympic Princess (above), a modern DP2 PSV, was secured and converted to suit the needs of the job. The conversion was planned to provide redundancy in executing each treatment and to allow the vessel’s stimulation capacity to be attractive to other users in the area. Table 1 provides the equipment listing for the vessel.
Coiled tubing reel. To lift the 42te, 23/8in coiled tubing reel onto the jackup barge, the reel was stripped of internal pipework and a drop-in power stand was selected to reduce weight. The reel was lifted onboard from the jack-up barge at its previous location and sea-fastened for the journey to the normally unmanned installation. The efforts avoided any need for spooling and/or welding offshore, a high-risk activity given the number of coiled tubing interventions planned.
 Table 2. Results of breakdown analysis.
Flowback spread. The flowback spread consisted of a liquid-only flowback loop and a multiphase flowback loop. The liquid-only loop consisted of an adjustable choke and a shaker system to take returns during coiled tubing interventions when the formation is plugged off and an overbalance maintained. The multiphase loop could be activated at any time and consisted of two high-pressure sand knockout vessels, high-pressure dual sand filters, a choke manifold, a heater, a high-pressure separator, gauge tank, stock tanks, and water treatment facilities.
Vessel rigging up operations commenced in early October 2009 in Montrose, Scotland, and were completed and commissioned within three weeks. The vessel sailed to the Netherlands in preparation for the first fracture treatment. Proppant, brine and chemical additives were stored in IJmuiden, allowing the vessel to rapidly re-supply after each fracturing operation.
 Figure 1. Fracture dimensions and conductivity for Fracture 1.
Each fracture treatment was designed for 250,000lbm of proppant to be placed using 150,000 gallons of fluid at a pump rate of at least 20bpm and surface pressure of 8000psi. A hydraulic fracturing spread of 12,000hhp with 700,000lbm of proppant storage and 400,000 gallons of fluid storage was designed and installed.
Fracturing procedure
Fracturing operations began in November 2009. Following a liner cementation check and depth reference run on coiled tubing, the first set of perforations was made with a sand-jetting toolstring containing three nozzles at 120° phasing. The perforations were made by pumping a linear gel laden with 100-mesh sand at a specific rate for a specific time period before pulling out of hole (POOH) by 0.25m. In total, 12 perforations were made at each interval within 0.75m. A circulation sub was then opened with a drop ball, and the gel and sand were cleaned out.
Following a series of datafracs to measure injectivity, the main fracture treatment was pumped at 30bpm. Slurry stages from 1ppa to 10ppa were then pumped, with a tail-in of 14.5ppa to make the proppant plug. The slurry was displaced with 35bbl crosslinked gel followed by linear gel. A total of 128,000lbs of proppant was placed in the formation for stage one.
Coiled tubing was used to clean out sufficient fill to access the next stage and sand-jet perforations.
A pressure test was conducted on the remaining fill to test its suitability to isolate the first stage treatment. The closed in tubing head pressure (CITHP) was increased to 345 bar and held for 10 minutes with success.
This same general process was repeated for the remaining four fracture stages.
Following well clean up, during which the volume of fluid returned on location was 13.3% of the total fracturing fluid injected, the well was hooked up to the facilities and production commenced.
 Table 3. Results of main fracture treatment analysis.
 Figure 2. Pressure distribution in the reservoir after one year of production.
 Figure 3. Production forecast for four years based on history match of first year’s production.
 Robin Naughton-Rumbo joined Shell in November 2005 having earned his Master’s degree in mechanical engineering from Imperial College, London. He built up his competence as a completions and well interventions (C&WI) supervisor and engineer with NAM in the Netherlands and on assignment to Pinedale, Wyoming, US. He spent two years broadening his expertise as a contract holder. He is currently on assignment in Sichuan, China as C&WI operations team lead for the exploration and appraisal activities on two unconventional gas fields.
 Erik Schrama studied offshore engineering at Delft University of Technology and joined Shell in 2003 as a production technologist. After two years in R&D and technical services and a spell working in Siberia’s Salym field, he joined Shell’s offshore operating unit in the Netherlands in 2006. During 2009/10 he project managed the drilling and hydraulic fracturing phase of the first offshore tight gas development using a horizontal well with multiple fractures. He currently works as a senior production technologist for Shell subsidiary Petroleum Development Oman.
 Josef Shaoul, engineering manager at Fenix Consulting Delft (formerly StrataGen Delft), conducts fracture stimulation studies, on-site fracture engineering, Fracpro training courses, welltest analysis, reservoir simulation studies and software development. He worked at RES from 1989-96, where he was the lead software engineer for development of Fracpro. He has over 20 years’ industry experience and received his Bachelor’s and Master’s degrees from MIT in electrical engineering and computer science.
 Fred van der Bas is a subject matter expert on hydraulic fracturing at Shell based in the Netherlands, where he has worked for more than 30 years. After his physics study he joined Shell Research in the petrophysics department and then moved to production technology working on well stimulation research projects with a focus on fracturing. He is currently supporting the design, execution and evaluation of Shell’s fracturing operations in Europe, Asia and Africa.
 Mark Norris, stimulation domain manager and engineering advisor for Schlumberger Well Services in Aberdeen, is involved in multidisciplinary engineering for major North Sea stimulation campaigns while extending support and experience to the operational phases. Since receiving his Bachelor’s degree with honors from Robert Gordon University in engineering, he has accumulated over 30 years’ industry experience working in well construction and reservoir stimulation and was recently recognized by the SPE for his contribution to industry.
Fracture treatment analysis
The fracture treatment data was evaluated on a zone-by-zone basis to estimate the average formation permeability and the fracture dimensions. A summary of the breakdown injection analyses is shown in Table 2. The estimated permeability, which is based on the fluid leaking off from the fracture while it is closing, varied from 16μD to 40μD. This was quite close to the pre-fracture estimate of 50μD average permeability to gas (at in situ conditions).
The simulated fracture dimensions for Fracture 1 (Figure 1) were slightly smaller than the total payzone height. Screenout was attributed to a width restriction at the wellbore, combined with the large diameter proppant (16/20 mesh). To avoid screenout in subsequent zones, treatment execution was altered by pumping smaller proppant volumes with larger pad volumes and lower maximum proppant concentrations. The resulting fracture half-lengths were also shorter, with less propped fracture width, as summarized in Table 3.
Post-fracture
Initial post-fracture production from the well was lower than expected, based on pre-fracture simulations. Because no well test (with buildup) was performed following the initial cleanup, there was uncertainty in trying to ascertain the cause of the production discrepancy. An initial analysis with a simple 2D model, using only the first few weeks of production data, suggested that the poorer-than-expected production could be due to poor cleanup of the proppant pack, which led to a reduced effective propped length - a phenomenon often observed in tight-gas wells.
During the first year of production, the gas rate did not exhibit the steep decline typical of tight-gas wells, and the surface pressure remained constant at 33 bar. A calculated bottomhole pressure (BHP) was generated using a wellbore model, which was used for history matching the first year of production with a full 3D reservoir simulation model. The production record contained several shut-ins, which also gave valuable information about the reservoir pressure evolution.
A 3D reservoir simulation model was created by upscaling the geological model; porosity, permeability and water saturation data were also upscaled. The simulation model was constrained by using the measured (allocated) daily gas production rate. However, during the initial cleanup period, a measured water rate was also available. The first step in the history matching process attempted to match the observed water rate and the production logging tool (PLT) results. By reducing the effective fracture length for the different zones, it was possible to match both the water production and the PLT results. The results of this initial matching of the early time production gave an estimated effective fracture half-length on the order of 25m for the first four zones, and a much better length of 55m for the final fracture (#5). With these parameters, it was only possible to match early time behavior.
Matching the remaining part of the first year of production required an improvement to the model to reflect that the actual well production index (PI) was increasing during that time; these increases were most pronounced after each well shut-in. This match was made by increasing the effective length of each of the five fractures over time, corresponding to the points where the well’s PI increased. It was also noted that to match the buildup data, a significant near-wellbore choke effect had to be added to the model, consistent with convergent flow in the fracture due to the very short perforated intervals.
At the end of the simulation, all five fractures were producing with their total propped length open to flow. In this interpretation, it took one year for the propped fractures to fully cleanup. The average formation permeability in the history-matched model was about 0.02-0.03mD at initial water saturation, which agreed well with the permeability of 0.02-0.04 mD estimated from the fracture treatment data analysis.
This analysis was used to predict long-term production. The pressure distribution at the end of the first year of production, shown in Figure 2, highlights the elliptical pressure around the horizontal well. At this point, the reservoir boundary had not been reached, and the production simulation predicted that this would occur in the higher permeability layers after more than two years of production.
The forward simulation (Figure 3) also predicted that the total water production after five years will still be only 1400m3 out of the 2100m3 of fracture water pumped into the well.
Future recommendations
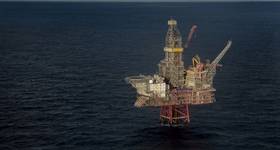
For the first time in the North Sea a true tight gas reservoir was successfully developed using a horizontal well with multiple fractures. The production improvement compared to an unfractured horizontal well approached a factor six, which is very encouraging for future tight gas developments. The one-year production match using a numerical reservoir simulator has provided valuable insights to explain why the well’s production has remained constant for such a long time.
For future wells of this type, a variety of methods can be used to reduce the effect of convergent flow at the perforations.
Tail-in with a small volume of an even larger proppant size (ie 12/18). Given the low permeability, the main proppant for the treatments could actually be a smaller size (ie 20/40), which should also reduce the risk of near-wellbore screenout.
After executing all the fracture treatments, jet or perforate additional holes over the same interval, increasing the total perforated length from 600mm by a factor of two or three. While the new perforations may not hit the longitudinal fracture, any increase in inflow area will significantly reduce the near-wellbore pressure drop.
Finally, to try to reduce proppant pack damage in the near-wellbore area caused by pressure testing of the proppant plugs, it is recommended to increase breaker concentration in the flush fluid. OE
 Subscribe